Professor
Joop Varekamp
Teaching Assistants:
Eli Fierer 343-9273
Cara Smith
RESULTS OF OUR CO2 MONITORING PROJECT
CLICK HERE
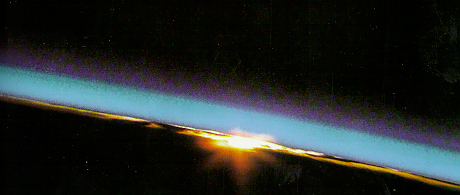
The role of CO2 in earth processes is very large relative to the modest quantities of it that are present in the atmosphere. In this course we will study all aspects of the physics, chemistry and biology of CO2. The course is structured around the new atmospheric CO2 monitoring facility in the E&ES department.
In addition we will look into the structure of CO2 molecules, techniques to measure CO2 , and carry out experiments with growing plants.
The E&ES CO2 monitoring site will begin collecting data when the course starts. We will compare the Wesleyan CO2 record with those from elsewhere and interpret variations in measured CO2 contents at different time scales (day/night; weekly, seasonal, long-term) in terms of local and regional fluxes of CO2.
We will extract CO2 databases from the WEB and replot them with our data, calculate fluxes of absolute amounts from data series, and other computer exercises.
We will do some class lab exercises with the program SIMEARTH - you can manipulate the intensity of the sun, the extent of the biosphere, atmospheric CO2 and more, and create your own ice ages and global warming scenarios.
Student groups will create scenarios of global warming
for emission densities of CO2 in the world, and write essays
or give presentations on scientific and political aspects.
To learn more about Earth Science go to the UC Berkeley Geology website
To learn more about photosynthesis in the oceans, go to Emiliani Huxleyi
Questions addressed:
What
is the role of CO2 in global climate (greenhouse gas)?
Related
Links:Emissions
in U.S.
CO2
Cycling
GLOBAL WARMING
How does photosynthesis work?
Related Links: photosynthesis
diagrams
Lecture
notes Kristina Beuning
How
does CO2 acidify surface waters?
Related Links:Urinary
bicarbonate effects
CO2's relationship
with pH
How
much CO2 is there on other planets?
Related Links: planetary
inventory
How
has atmospheric CO2 varied over the course of earth's history?
Related Links: CO2
and Global Climate Change
Lecture
notes Ellen Thomas on Clathrates
and Paleocene warming
Influence of PLANTS
What should we do to prevent
further global warming - the Kyoto treaty
Related Links: Kyoto
protocol
EPA's
Global Warming Site
EMISSION TRENDS
Sources of anthropogenic CO2 Fossil fuel burning, the missing carbon
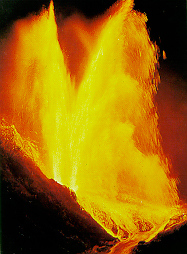
How much CO2 is arriving at the surface from volcanic activity? see the lake Nyos movieclip and click on my picture (needs real video)
Volcanic Sources of Carbon Dioxide: Volcanic Degassing at Mammoth
********************************************************************************************
Course Outline:
==>Introduction Roles of CO2 on earth
- Venus-Earth-Mars:
3 planets - three climates, composition of the terrestrial
atmosphere 3.5 billion years ago, similarities with Venus; composition
now ==> dominant influence of plant life
==> CO2 Forms of CO2 on earth - CO2 gas, H2CO3 and other species in water; carbonate equilibria; limestone Lecture notes 1 + 2 + problems
==> The carbon cycles: The long and the short carbon cycle, limestones, chemical weathering Lecture notes 3+4 + problemset # 2. The long carbon cycle - readings
==> The Black
Sea - an environment loaded with organic carbon
second
black sea link
==> The photosynthetic process, C3 and C4 pathways, energy, chemistry
==> The isotopes of carbon 14C, 13C
and 12C, formation, applications
Isotopes
of Carbon
SPRING BREAK
==> CLIMATE FUNDAMENTALS (HANDOUTS)
Calculate the "blackbody temperature" of Venus, Earth and Mars, assuming
no atmosphere on these planets. The distances from the center of the sun
to the center of the planets are as follows: Venus:108 million km; Earth:
150 million km; Mars:228 million km. All other constants are in the table
in the back of the handout. To do it right, you can express the distance
from the sun to the planets in units of solar radii. Use Boltzman and Wien,
knowing that the maximum wavelength in the solar spectrum is around 0.48
micrometer.

==> The earth climate record (long-term) and variations
in atmospheric CO2
(articles)
==> The human impact: Increase in CO2 levels
since AD 1850, ice core records, comparison with last 20,000 years
Monitoring CO2 Techniques for monitoring,
analytical devices, computer data storage
Quantitative techniques Plotting, integrating,
data precision
Local versus global signals, mixing times of the atmosphere,
problems with public policies
Limiting CO2 emissions The CO2
treaties (Rio de Janeiro, Kyoto)
CO2 disposal Burial in aquifers, deep ocean
storage
CO2
sequestration in the deep ocean
Conclusions
False colour images of the world indicating the abundance
of chlorophyl ("plants") on land and in the oceans
Upper figure: green areas have high biomass density, orange have little
plants
Lower Figure: red zones: highest chlorophyl concentrations; blue lowest
chlorophyl concentrations